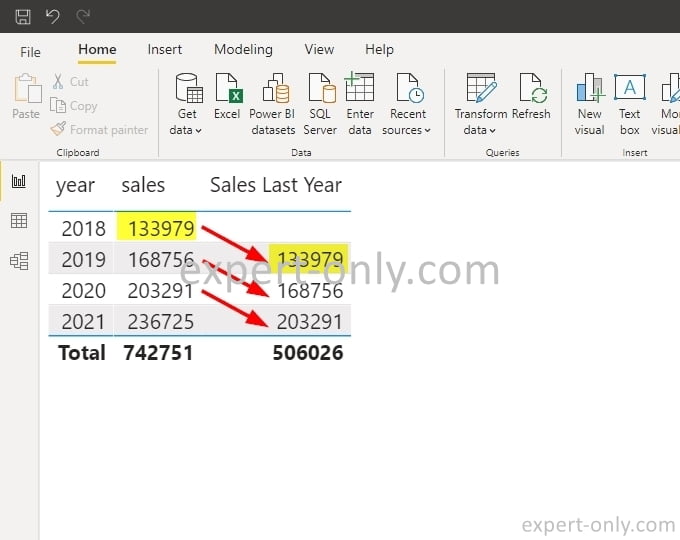
Power BI tutorial on how to use the SAMEPERIODLASTYEAR function in a DAX formula to calculate the last year value.
To calculate the previous year value in a Power BI formula, simply use the two available DAX CALCULATE function combined with the PREVIOUS YEAR function. In financial dashboard and reports, use the previous year value for comparison and variance calculation with the current year. Indeed analysing financial figures is often about time comparison and rolling forecasts. Financial forecast uses rolling months, quarters or years.
Use the SAMEPERIODLASTYEAR time function in Power BI
The SAMEPERIODLASTYEAR function in DAX is an advanced time-intelligence function tailored to make comparative analyses across identical periods in consecutive years. Unlike the Power BI PREVIOUSYEAR function, which only shifts the date context back by a year, SAMEPERIODLASTYEAR maintains the structure of your specified time period, whether it’s a quarter, month, or even a custom time span.
This particular feature is beneficial to identify seasonal patterns or irregularities in the data. Importantly, this function works most effectively when you have a well designed date table in your Power BI model and that this table is marked as a date table. Doing so ensures that your date hierarchies are accurately understood by DAX, allowing SAMEPERIODLASTYEAR to execute seamless transitions in the time context.
For instance, with a measure names sales, representing the current year:
Sales := SUM('Sales'[Amount])
It is possible create a new DAX measure for the previous year sales, called Sales LY, in order to get last year’s sales for the same date range. This feature enables nuanced analysis and lends greater fidelity to your business intelligence insights.
Sales LY := CALCULATE([Sales], SAMEPERIODLASTYEAR( 'time'[date_key]))
This formula would filter the sales data to include only the revenue from the previous calendar year, allowing for nuanced and strategic business planning.
Calculate last year value in Power BI using one DAX formula
The simplest option is to use directly the value from an existing column from the source table. The developer or business user imports the existing column in a Tabular Model or Power BI. Please note that it is necessary to use the REMOVEFILTERS function to display the results.
Sales Last Year =
CALCULATE (
    SUM ( sales[sales] ),
    SAMEPERIODLASTYEAR ( 'time'[date_key] ),
    REMOVEFILTERS ( sales )
)

To go further, the term DAX stands for Data Analysis Expression and it’s a Microsoft language. For example, PowerPivot, Power BI reports and dashboards and also Tabular models use the DAX language. Check out the detailed documentation of the two functions from this article on the official Power BI website:
- The official documentation for the DAX CALCULATE function.
- And the official documentation for the DAX SAMEPERIODLASTYEAR function.
Conclusion
This article is about the calculation of last year value in DAX for Power BI, but it also applies to the creation of time measures in an Analysis Services tabular model.
Check out this frequently asked questions about DAX and Power BI
Per default, the total of last year sales are not calculated automatically by the software. However, DAX for Power BI allows creating a measure using time functions to calculate the previous year sales.
In Power BI there are many options to calculate new measures, including the ones with time functions. Use the base column mapped from a table or other measures.
DAX stands for Data Analysis Expressions, and it’s used to create measures and calculations for Power BI and Power BI. For example, Analysis Services cubes contain MDX code.
The DAX function to calculate the last year is the PREVIOUSYEAR built-in Power BI function, it returns all the dates till the year provided as an input parameter.


Be the first to comment