Step by step tutorial to develop an SSIS package to transform data from rows to columns in a dataflow with the PIVOT transformation.
SSIS packages natively allows you to pivot data from rows to columns inside a DataFlow, it can be from a SQL Server table or a file. But how to perform the operation in practice inside an SSIS package? This step-by-step tutorial explains how to set up the PIVOT component options and transform data from rows to columns. In the example used, there is one target column per month of the year. It uses a single column to rotate.
Indeed, the component does not allow you to rotate more than one column without using the advanced editor and SSIS internal column numbers, called LineageID. Generally speaking, data pivoting is commonly used in Excel Pivot tables, for example.
Table of Contents
1. Create SQL source table with data stored in rows
First step: create the sales table with the monthly values in rows using SSMS, it is a basic SQL Server Create Table statement with a primary key.
2. Insert the dataset to Pivot to columns using SSIS
Then Insert a dataset to fill the table with 2 years of data, i.e. from the January 2021 to December 2022.
The resources are available in the SSIS training course.
3. Create target table with data in columns
The third script creates the table to store the data after the pivot which contains each month in a dedicated column, plus the year. Indeed, the key is the Year and the Month.
The resources are available in the SSIS training course.
4. Create SSIS data flow and add Pivot transformation
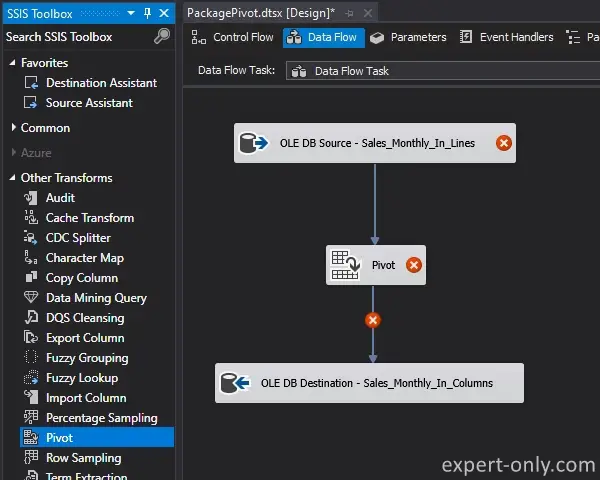
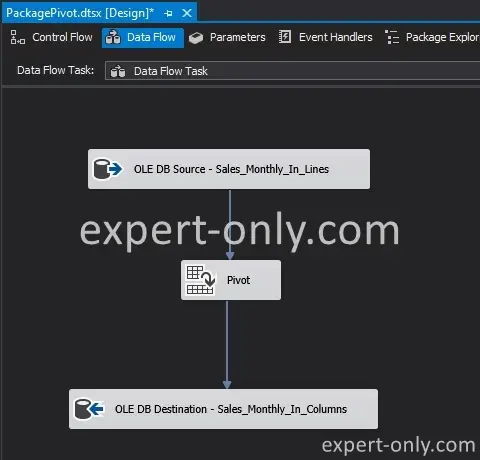
This part of the tutorial is the heart of the post, as it is about setting up the data flow that will transform the data. First of all, you need to create a package within an SSIS project and configure a connection to a SQL Server database. Then, add these 3 components to the data flow.
- OLE DB Source component
- SSIS Pivot transformation
- OLE DB Destination component
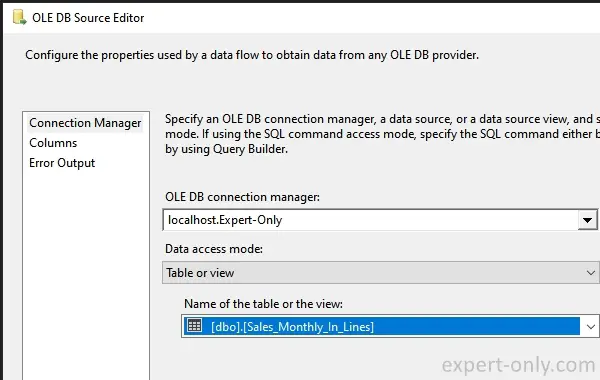
5. Configure the data flow source
Select the Sales_Monthly_In_Lines table as the source of the OLE DB Source component.
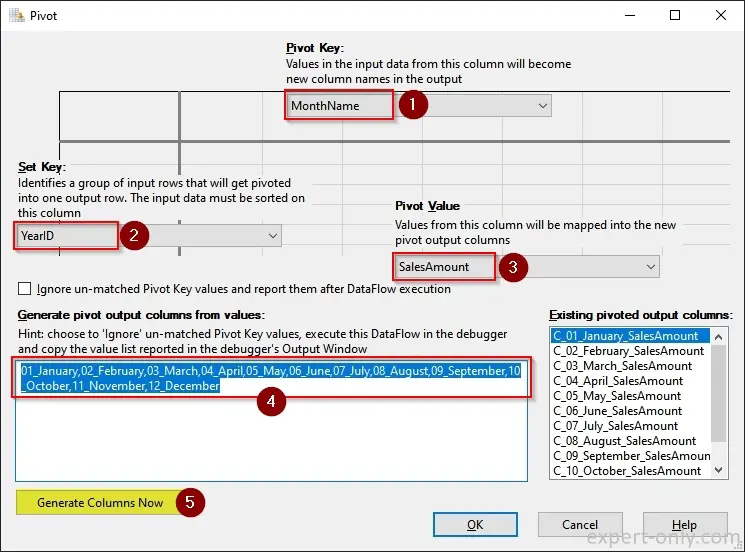
6. Configure SSIS PIVOT to transform rows to columns
Now configure the SSIS Pivot transformation with the following five steps:
- Choose the pivot key whose values become the name of the new columns: MonthName
- Choose the key column that will remain in the output: YearID
- Select the source column that contains the values: SalesAmount
- Enter the list of columns created by the Pivot, separated by a comma: 01_January to 12_December
- Generate the columns to fill the right area with the new pivoted columns.
The list of column names is as follows, without spaces because the SSIS Pivot component uses spaces in the automatically generated column names.
01_January,02_February,03_March,04_April,05_May,06_June,07_July,08_August,09_September,10_October,11_November,12_December
Note: It is only possible to fill in one Key column to pivot columns. To pivot a table with more grouping columns, use the advanced editor and SSIS column identifiers.
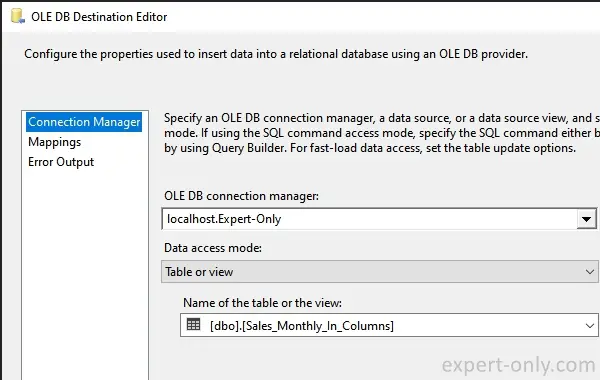
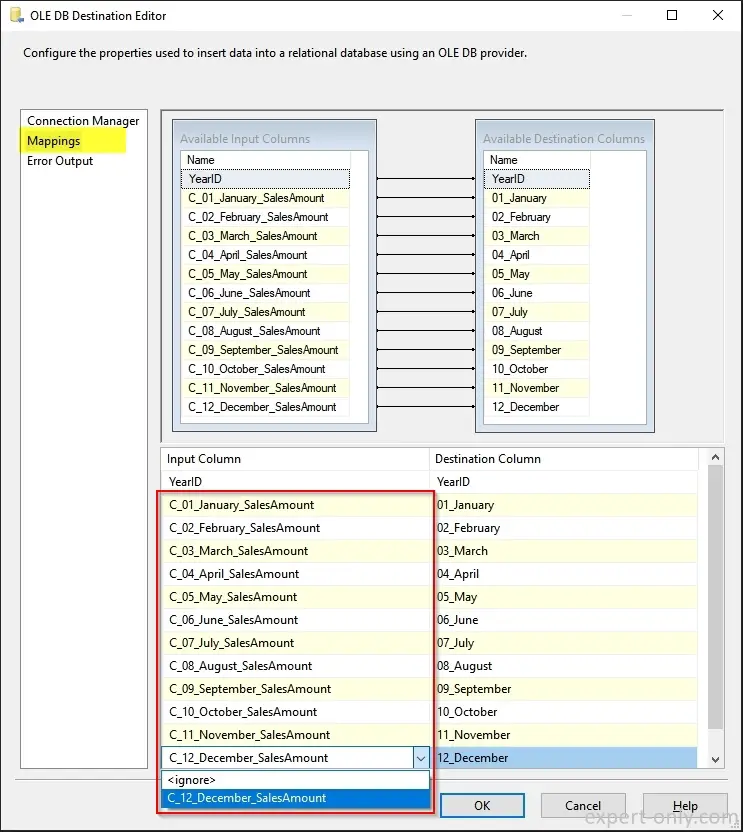
7. Set up destination table in the SSIS Data Flow
Select the destination table to store the data in the SQL Server database, after the Pivot operation. So the target table is the dbo.Sales_Monthly_In_Columns table created in step 1.3 of this tutorial.
From the Mappings tab this time, manually link each source column with the corresponding target column, i.e. the 12 columns generated for each month of data.
Once all the components are properly configured, Visual Studio does not display any errors or warnings anymore. If it does, check the links and the data types to make sure they are compatible.
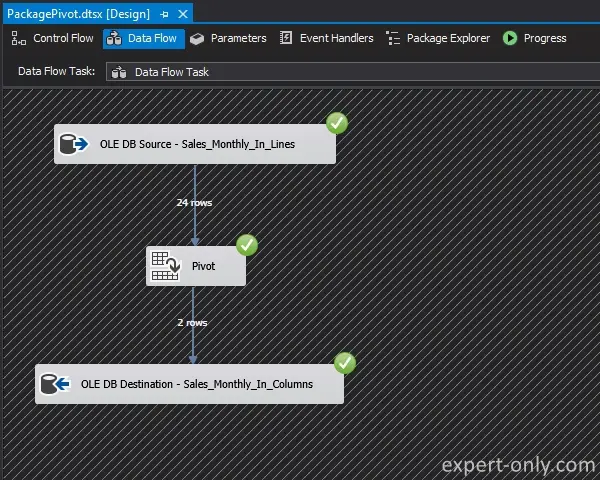
8. Run the SSIS Package to Pivot the rows
Now run the package to transfer and rotate the SQL Server data from row format to column format. The 24 rows of the dataset, i.e. 24 months, are rotated into only 2 rows, i.e. 2 years of sale data.
9. Check data in target table after Pivot using SSMS
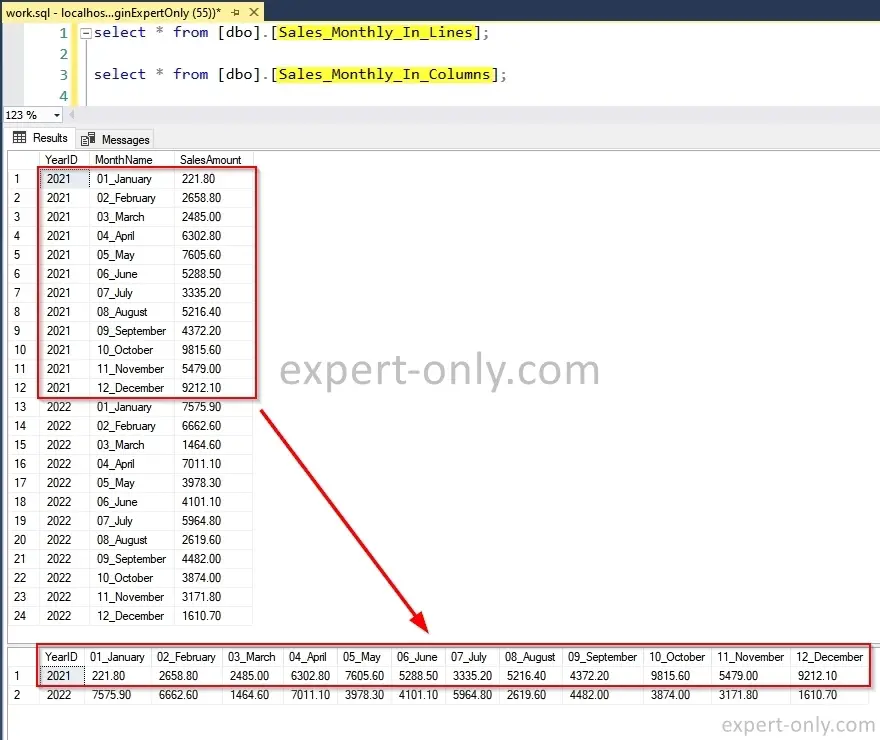
Once the SSIS package is successfully executed, connect to the database with SQL Server Management Studio and execute these 2 data selection queries. The result is consistent with the first table having 24 lines of data, i.e. 12 lines for 2021 and 12 lines for 2022 in the same column. Notice in the second query, the same amounts for 2021 on one row and the year 2022 on another row.
select * from [dbo].[Sales_Monthly_In_Lines];

select * from [dbo].[Sales_Monthly_In_Columns];
A word about the SSIS Pivot transformation
To conclude this technical SSIS article on how to pivot rows into columns using the Pivot transformation, the native component allows you to easily pivot rows in a SQL table, but the table must have a simple structure. In other words, it handles a single, static grouping column. For more complex cases, it is recommended to use the more flexible and easier to maintain T-SQL PIVOT query as a data source in the SSIS package.
Many other techniques to pivot data using Microsoft
- Pivot Rows To Columns in SQL Server using one query
- SQL Server PIVOT Query that dynamically adapts to the output columns
- Pivot Excel data from rows to columns
About the Unpivot operation in SQL Server
The opposite operation is about transforming data from a columns format into a rows format. Find below a few articles on how to use the Unpivot operator in SSIS and in T-SQL.


Be the first to comment